
Note
Click here to download the full example code
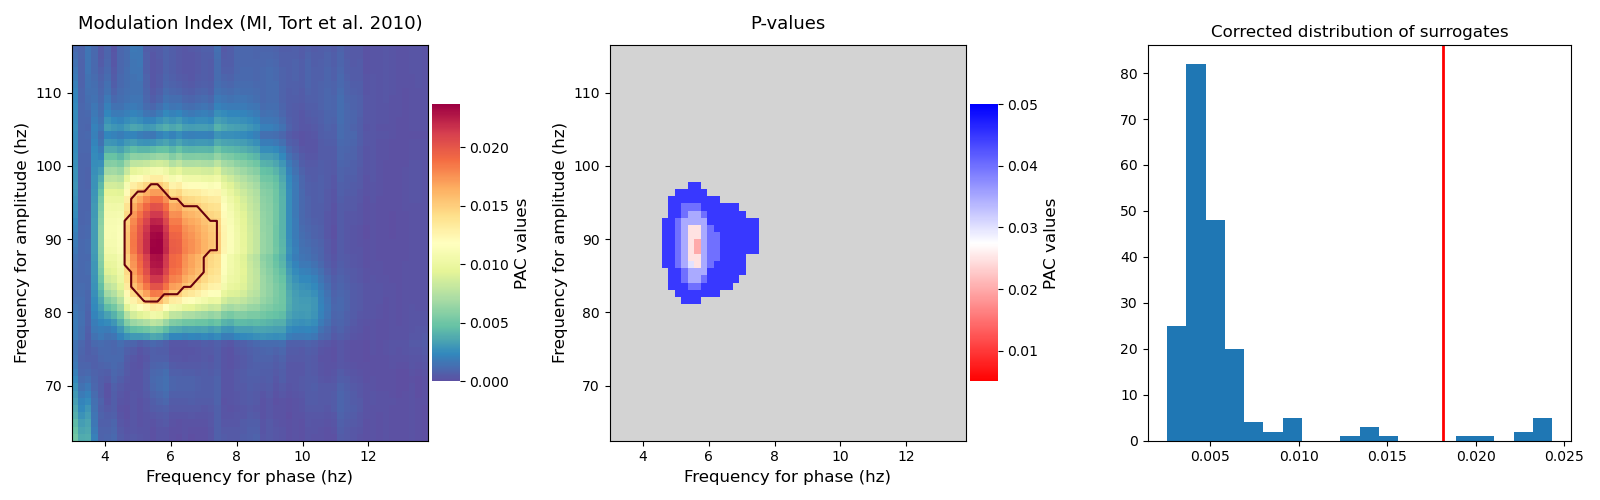
Compute and plot the p-values
This example illustrates how to compute and plot the p-values. To this end, Tensorpac uses permutations to estimate the distribution of PAC that could be obtained by chance. Then, the true PAC estimation is compared with those surrogates in order to get the p-values.
Note that the correction for multiple comparisons is automatically performed across all phases and amplitudes. Tensorpac uses the maximum statistics to perform this correction. Indeed, the permutations are computed for each (phase, amplitude) pairs. The p-values are then inferred using the maximum across all of the pairs.
from tensorpac import Pac
from tensorpac.signals import pac_signals_wavelet

import matplotlib.pyplot as plt
Simulate artificial coupling
first, we generate a single trial that contains a coupling between a 6z phase and a 90hz amplitude. By default, the returned dataset is organized as (n_epochs, n_times) where n_times is the number of time points and n_epochs is the number of trials
f_pha = 6       # frequency phase for the coupling
f_amp = 90      # frequency amplitude for the coupling
n_epochs = 1    # number of trials
n_times = 4000  # number of time points
sf = 512.       # sampling frequency
data, time = pac_signals_wavelet(f_pha=f_pha, f_amp=f_amp, noise=.8,
                                 n_epochs=n_epochs, n_times=n_times, sf=sf)
Compute true PAC estimation and surrogates distribution
Now, we compute the PAC using multiple phases and amplitudes such as the distribution of surrogates. In this example, we used the method proposed by Bahramisharif et al. 2013 [2] and also recommended by Aru et al. 2015 [1]. This method consists in swapping two time blocks of amplitudes cut at a random time point. Then, we used the method
tensorpac.Pac.infer_pvaluesin order to get the corrected p-values across all possible (phase, amplitude) frequency pairs.
# define the Pac object
p = Pac(idpac=(2, 2, 0), f_pha=(2, 15, 2, .2), f_amp=(60, 120, 5, 1))
# compute true pac and surrogates
n_perm = 200  # number of permutations
xpac = p.filterfit(sf, data, n_perm=n_perm, n_jobs=-1,
                   random_state=0).squeeze()
# get the corrected p-values
pval = p.infer_pvalues(p=0.05)
# get the mean pac values where it's detected as significant
xpac_smean = xpac[pval < .05].mean()

# if you want to see how the surrogates looks like, you can have to access
# using :class:`tensorpac.Pac.surrogates`
surro = p.surrogates.squeeze()
print(f"Surrogates shape (n_perm, n_amp, n_pha) : {surro.shape}")
# get the maximum of the surrogates across (phase, amplitude) pairs
surro_max = surro.max(axis=(1, 2))

plt.figure(figsize=(16, 5))
plt.subplot(131)
p.comodulogram(xpac, title=str(p), cmap='Spectral_r', vmin=0., pvalues=pval,
               levels=.05)

plt.subplot(132)
p.comodulogram(pval, title='P-values', cmap='bwr_r', vmin=1. / n_perm,
               vmax=.05, over='lightgray')

plt.subplot(133)
plt.hist(surro_max, bins=20)
plt.title('Corrected distribution of surrogates')
plt.axvline(xpac_smean, lw=2, color='red')

plt.tight_layout()
p.show()
Out:
Surrogates shape (n_perm, n_amp, n_pha) : (200, 55, 55)
/home/circleci/project/tensorpac/visu.py:149: MatplotlibDeprecationWarning: You are modifying the state of a globally registered colormap. In future versions, you will not be able to modify a registered colormap in-place. To remove this warning, you can make a copy of the colormap first. cmap = copy.copy(mpl.cm.get_cmap("bwr_r"))
  im.cmap.set_over(color=over)
Total running time of the script: ( 0 minutes 6.924 seconds)