
Note
Click here to download the full example code
Long-range PAC
One thing you may have noticed, both the fit() and filterfit() methods take as inputs data and again data. The reason is that the first data refer to the signal to extract the phase (xpha) and the second, the amplitude (xamp). If you want to extract local coupling (i.e. on a source/electrode) both xpha and xamp have to be set to data.
from tensorpac import Pac
from tensorpac.signals import pac_signals_tort
import matplotlib.pyplot as plt
plt.style.use('seaborn-poster')
# First, we generate 2 datasets of signals artificially coupled between 10hz
# and 100hz. By default, those datasets are organized as (n_epochs, n_times)
# where n_times is the number of time points.
n_epochs = 20 # number of datasets
d1, time = pac_signals_tort(f_pha=10, f_amp=100, noise=1, n_epochs=n_epochs,
n_times=3000)
d2, time = pac_signals_tort(f_pha=10, f_amp=100, noise=3, n_epochs=n_epochs,
dpha=20, damp=5, chi=.3, n_times=3000)
# Define the model of PAC to use :
p = Pac(idpac=(4, 0, 0), f_pha=(2, 30, 1, 1), f_amp=(60, 150, 5, 5),
dcomplex='wavelet', width=12)
# Now, compute PAC by taking the phase of the first dataset and the amplitude
# of the second
xpac12 = p.filterfit(1024, d1, d2)
# Invert by taking the phase of the second dataset and the amplitude of the
# first one :
xpac21 = p.filterfit(1024, d2, d1)
# Plot signals and PAC :
plt.figure(figsize=(18, 12))
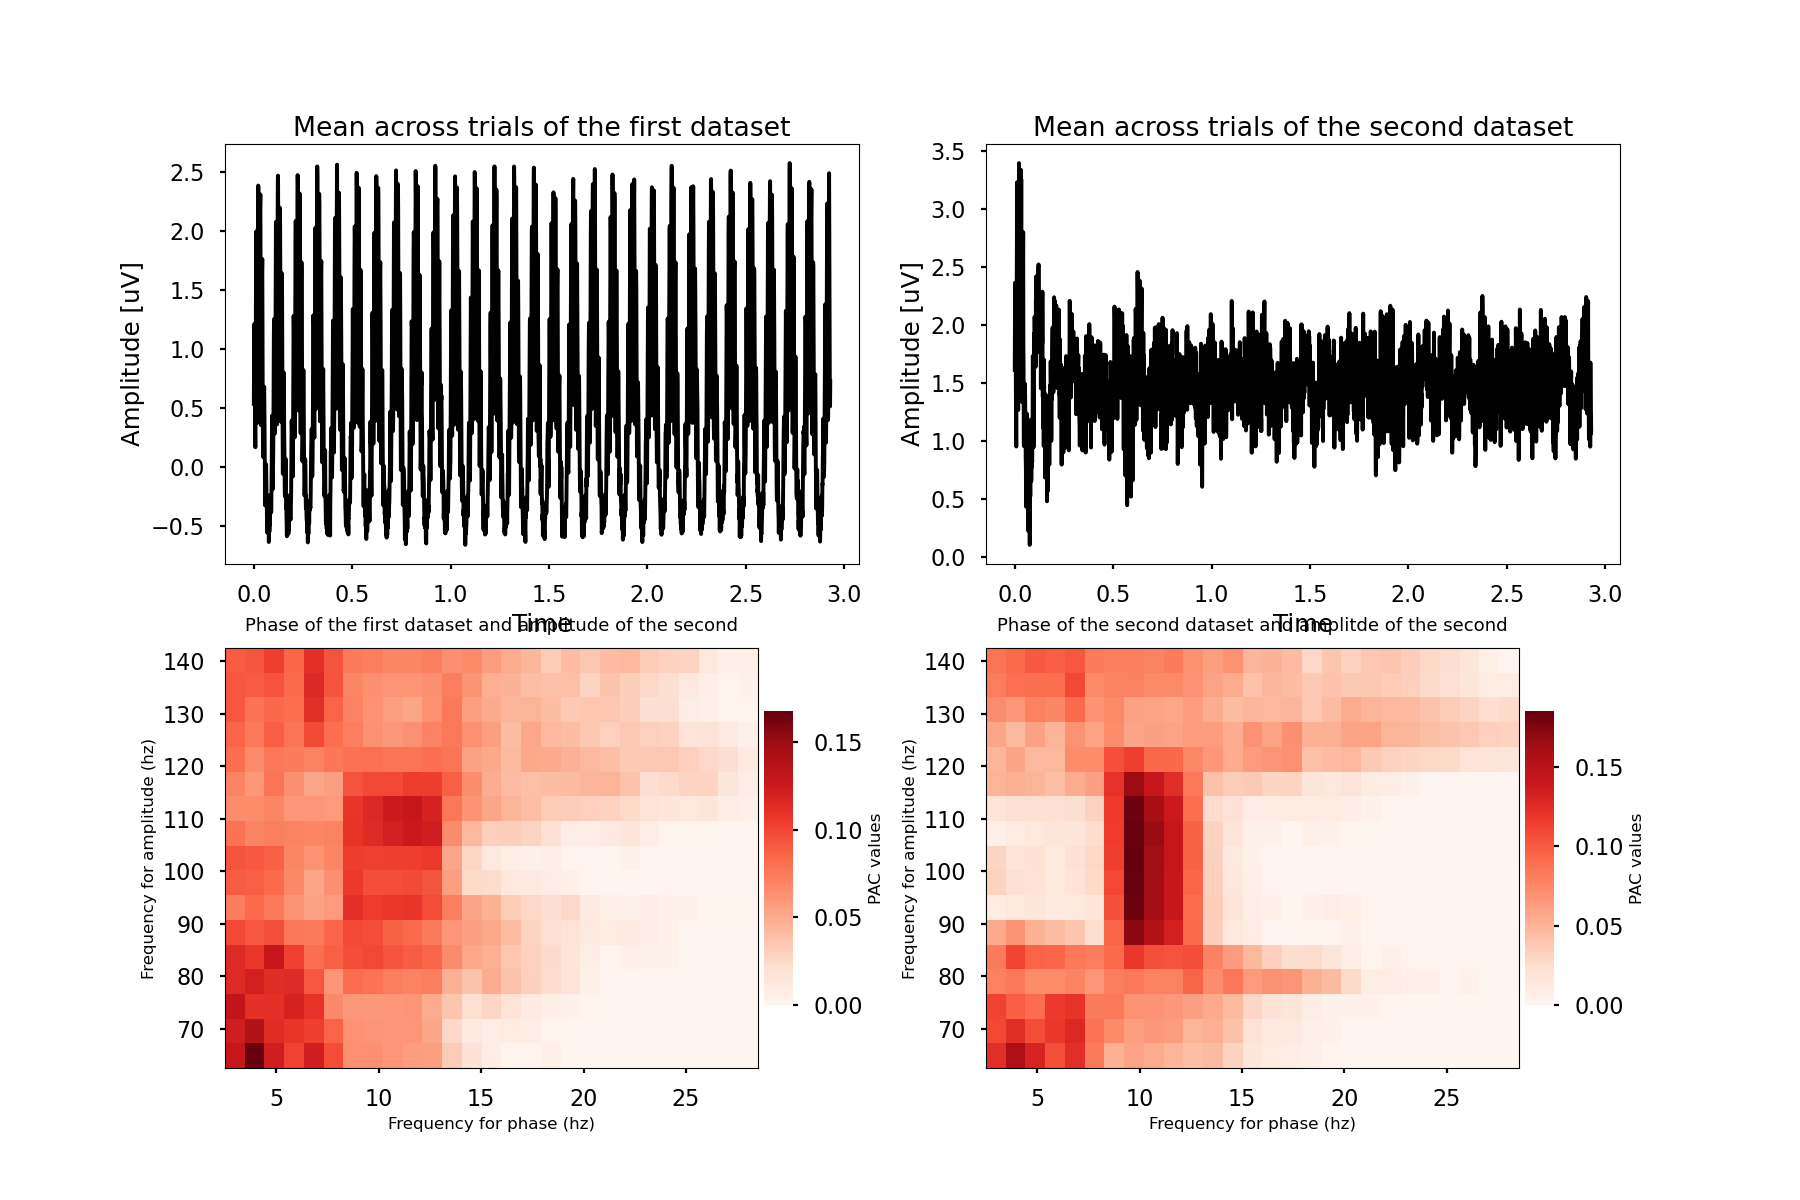
plt.subplot(2, 2, 1)
plt.plot(time, d1.mean(0), color='k')
plt.xlabel('Time')
plt.ylabel('Amplitude [uV]')
plt.title('Mean across trials of the first dataset')
plt.axis('tight')
plt.subplot(2, 2, 2)
plt.plot(time, d2.mean(0), color='k')
plt.xlabel('Time')
plt.ylabel('Amplitude [uV]')
plt.title('Mean across trials of the second dataset')
plt.axis('tight')
plt.subplot(2, 2, 3)
p.comodulogram(xpac12.mean(-1), title="Phase of the first dataset and "
"amplitude of the second", cmap='Reds')
plt.subplot(2, 2, 4)
p.comodulogram(xpac21.mean(-1), title="Phase of the second dataset and "
"amplitde of the second", cmap='Reds')
plt.show()
Total running time of the script: ( 0 minutes 5.292 seconds)