
Note
Click here to download the full example code
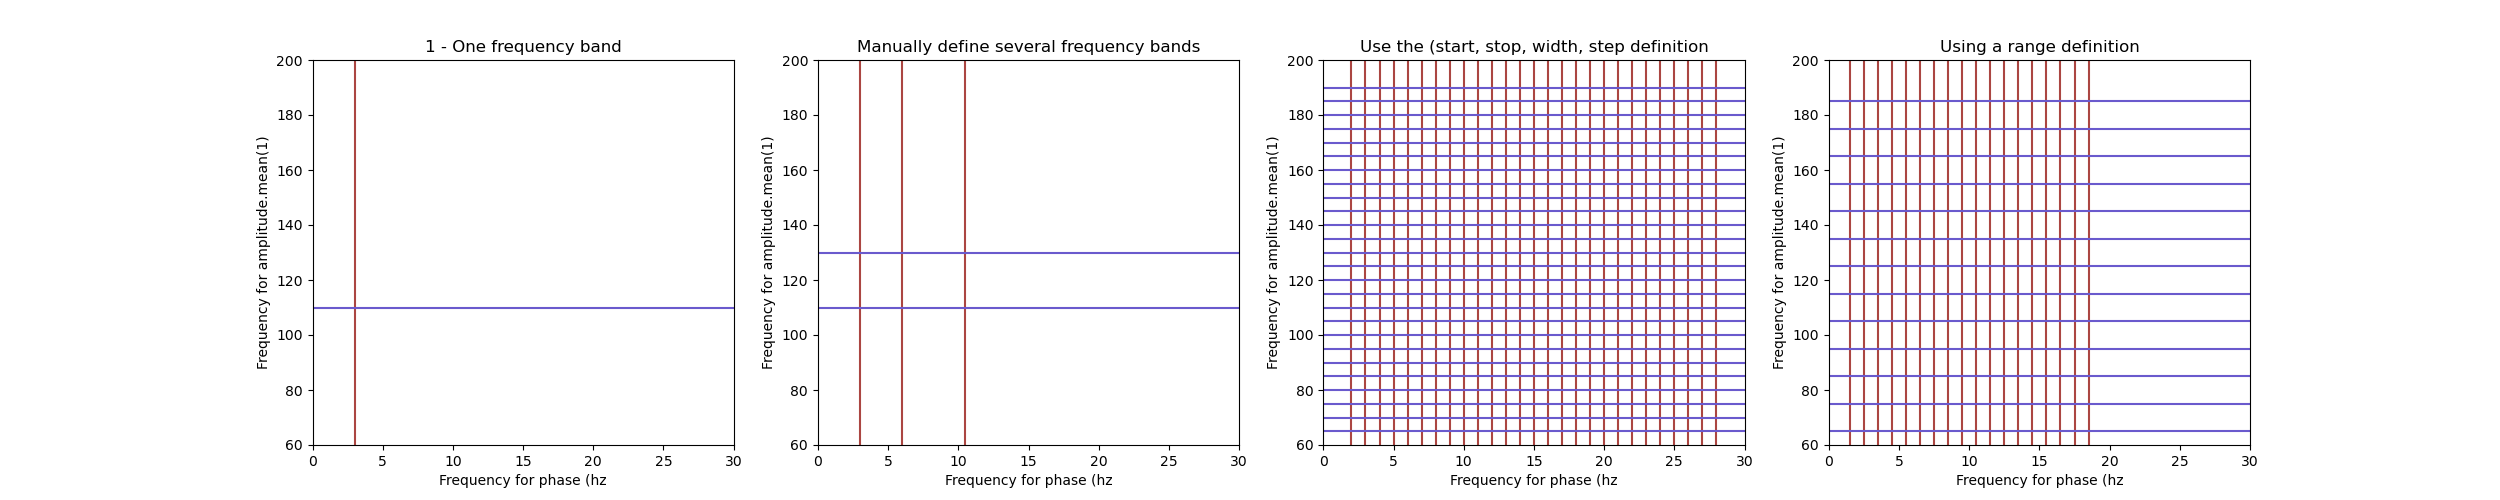
Define frequency vectors
In Tensorpac, you can define your phase and amplitude vectors in sevral ways :
Manually define one band (ex : [2, 4])
Define multiple bands using a list/tuple/array (ex : [[2, 4], [5, 7]])
- Using a (start, stop width step) definition. The latter lets you create regulary spaced bands [[start, start+width], [start+step, start+step+width],
[start+2*step, start+2*step+width], …]
Using a range : np.arange(1, 6) => [[1, 2], [2, 3], [3, 4], [4, 5]]
import matplotlib.pyplot as plt
import numpy as np
from tensorpac.utils import pac_vec


def plot(nb, pvec, avec, title):
    """Plotting function."""
    pvecm = pvec.mean(1)
    avecm = avec.mean(1)
    plt.subplot(1, 4, nb)
    plt.vlines(pvecm, -10, 500, color='#ab4642')
    plt.hlines(avecm, -10, 500, color='slateblue')
    plt.xlabel('Frequency for phase (hz')
    plt.ylabel('Frequency for amplitude.mean(1)')
    plt.title(title)
    plt.xlim([0, 30])
    plt.ylim([60, 200])


plt.figure(figsize=(25, 5))
# 1 - Manual defintion :
fpha = [2, 4]
famp = [60, 160]
pvec1, avec1 = pac_vec(fpha, famp)
plot(1, pvec1, avec1, '1 - One frequency band')

# 2 - List/tuple/array :
fpha = [[2, 4], [5, 7], [8, 13]]
famp = ([60, 160], [60, 200])
pvec2, avec2 = pac_vec(fpha, famp)
plot(2, pvec2, avec2, 'Manually define several frequency bands')

# 3 - (start, end, width, step) :
fpha = (1, 30, 2, 1)
famp = (60, 200, 10, 5)
pvec3, avec3 = pac_vec(fpha, famp)
plot(3, pvec3, avec3, 'Use the (start, stop, width, step definition')

# 4 - Range :
fpha = np.arange(1, 20)
famp = np.arange(60, 200, 10)
pvec4, avec4 = pac_vec(fpha, famp)
plot(4, pvec4, avec4, 'Using a range definition')

plt.show()
Total running time of the script: ( 0 minutes 0.416 seconds)