
Note
Click here to download the full example code
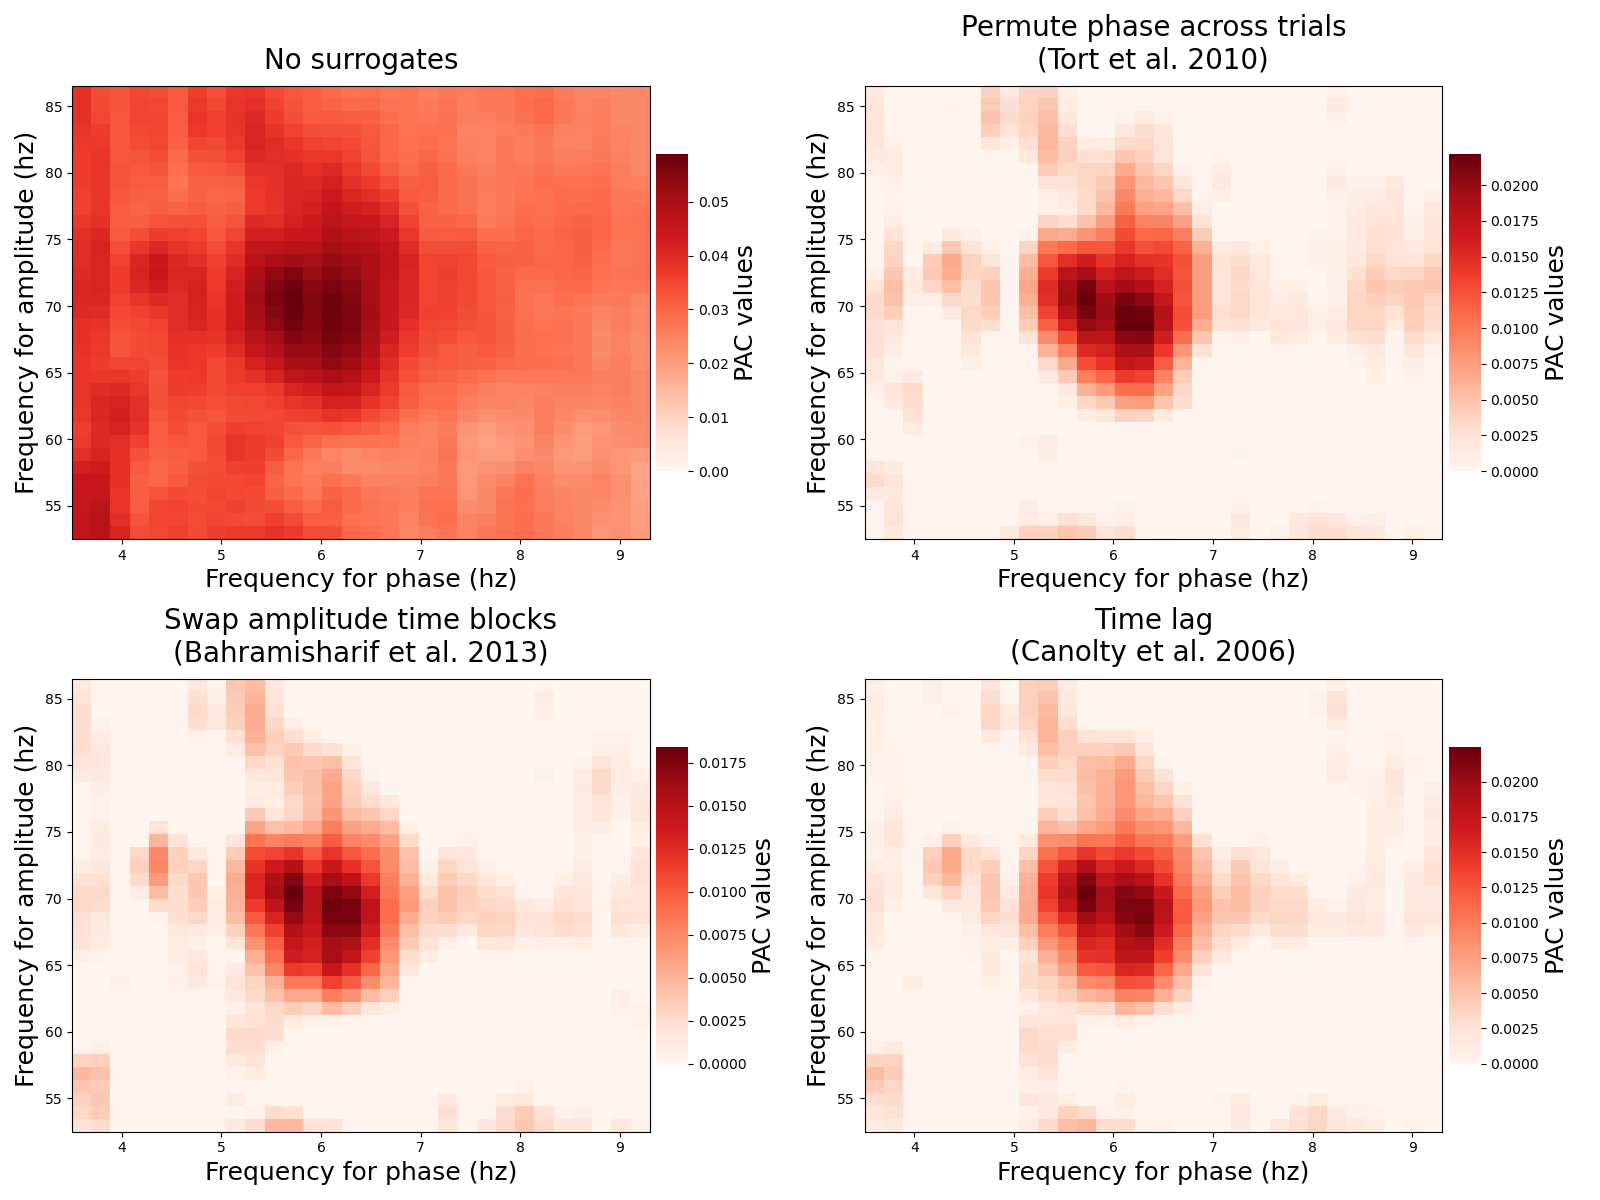
Compare methods to correct PAC for spurious coupling
This example illustrates the different implemented methods in order to generate the distribution of surrogates and then to correct the PAC for spurious couplings. This includes :
import matplotlib.pyplot as plt

from tensorpac import Pac
from tensorpac.signals import pac_signals_wavelet
Simulate artificial coupling
first, we generate several trials that contains a coupling between a 6z phase and a 90hz amplitude. By default, the returned dataset is organized as (n_epochs, n_times) where n_times is the number of time points and n_epochs is the number of trials
f_pha = 6       # frequency phase for the coupling
f_amp = 70      # frequency amplitude for the coupling
n_epochs = 20   # number of trials
n_times = 4000  # number of time points
sf = 512.       # sampling frequency
data, time = pac_signals_wavelet(sf=sf, f_pha=f_pha, f_amp=f_amp, noise=3.,
                                 n_epochs=n_epochs, n_times=n_times)
Extract phases and amplitudes
now, we are going to extract all the phases and amplitudes. This is going to be useful then because it avoid to do it each time we’re going to compute the PAC.
# define a :class:`tensorpac.Pac` object and use the MVL as the main method
# for measuring PAC
p = Pac(idpac=(1, 0, 0), f_pha=(3, 10, 1, .2), f_amp=(50, 90, 5, 1),
        dcomplex='wavelet', width=12)

# Now, extract all of the phases and amplitudes
phases = p.filter(sf, data, ftype='phase')
amplitudes = p.filter(sf, data, ftype='amplitude')
Compute PAC and surrogates
now the phases and amplitudes are extracted, we can compute the true PAC such as the surrogates. Then the true value of PAC is going to be normalized using a z-score normalization and using the distribution of surrogates
plt.figure(figsize=(16, 12))
for i, k in enumerate(range(4)):
    # change the pac method
    p.idpac = (5, k, 1)
    # compute only the pac without filtering
    xpac = p.fit(phases, amplitudes, n_perm=20)
    # plot
    title = p.str_surro.replace(' (', '\n(')
    plt.subplot(2, 2, k + 1)
    p.comodulogram(xpac.mean(-1), title=title, cmap='Reds', vmin=0,
                   fz_labels=18, fz_title=20, fz_cblabel=18)

plt.tight_layout()

plt.show()
Total running time of the script: ( 0 minutes 10.278 seconds)