
Note
Click here to download the full example code
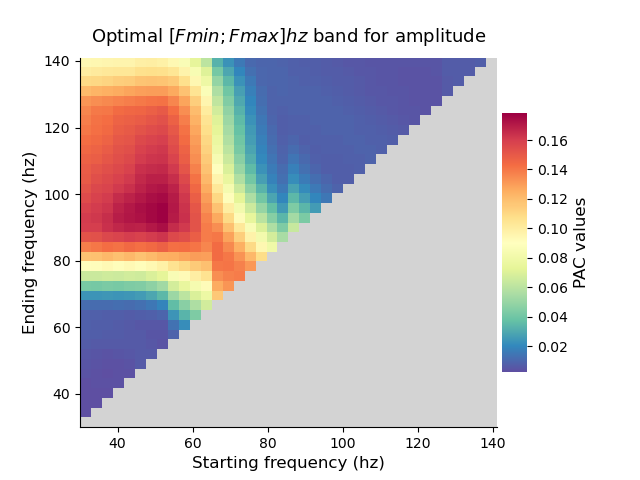
Find the optimal bandwidth
Instead of looking for phase and amplitude frequency pairs (as in a comodulogram) this example illustrate how it is possible to find starting, ending and therefore, bandwidth coupling.
Out:
/home/circleci/project/tensorpac/visu.py:151: MatplotlibDeprecationWarning: You are modifying the state of a globally registered colormap. In future versions, you will not be able to modify a registered colormap in-place. To remove this warning, you can make a copy of the colormap first. cmap = copy.copy(mpl.cm.get_cmap("Spectral_r"))
  im.cmap.set_bad(color=bad)
from tensorpac import Pac
from tensorpac.signals import pac_signals_tort
from tensorpac.utils import pac_trivec

sf = 256.
data, time = pac_signals_tort(f_pha=[5, 7], f_amp=[60, 80], noise=2,
                              n_epochs=5, n_times=3000, sf=sf, dpha=10)

trif, tridx = pac_trivec(f_start=30, f_end=140, f_width=3)

p = Pac(idpac=(1, 0, 0), f_pha=[5, 7], f_amp=trif)
pac = p.filterfit(sf, data)

p.triplot(pac.mean(-1), trif, tridx, cmap='Spectral_r', rmaxis=True,
          title=r'Optimal $[Fmin; Fmax]hz$ band for amplitude')

# In this example, we generated a coupling with a phase between [5, 7]hz and an
# amplitude between [60, 80]hz. To interpret the figure, the best starting
# frequency is around 50hz and the best ending frequency is around 90hz. In
# conclusion, the optimal amplitude bandwidth for this [5, 7]hz phase is
# [50, 90]hz.

# plt.savefig('triplot.png', dpi=600, bbox_inches='tight')

p.show()
Total running time of the script: ( 0 minutes 2.321 seconds)