
Note
Click here to download the full example code
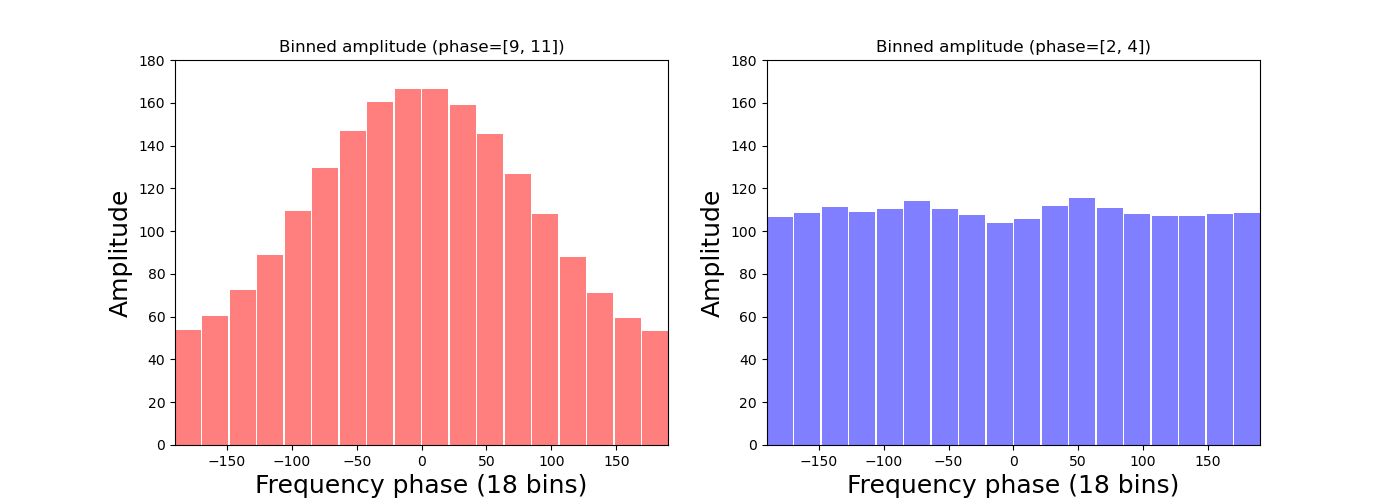
Bin amplitude according to the phase
This example illustrate how to bin the amplitude according to the phase.
from tensorpac.signals import pac_signals_tort
from tensorpac.utils import BinAmplitude

import matplotlib.pyplot as plt

# Dataset of signals artificially coupled between 10hz and 100hz :
n_epochs = 20
n_times = 4000
sf = 512.  # sampling frequency

# Create artificially coupled signals using Tort method :
data, time = pac_signals_tort(f_pha=10, f_amp=100, noise=2, n_epochs=n_epochs,
                              dpha=10, damp=10, sf=sf, n_times=n_times)

plt.figure(figsize=(14, 5))

plt.subplot(121)
b_obj = BinAmplitude(data, sf, f_pha=[9, 11], f_amp=[90, 110], n_jobs=1,
                     n_bins=18)
ax = b_obj.plot(color='red', alpha=.5, unit='deg')
plt.ylim(0, 180)
plt.title("Binned amplitude (phase=[9, 11])")

plt.subplot(122)
b_obj = BinAmplitude(data, sf, f_pha=[2, 4], f_amp=[90, 110], n_jobs=1,
                     n_bins=18)
ax = b_obj.plot(color='blue', alpha=.5, unit='deg')
plt.ylim(0, 180)
plt.title("Binned amplitude (phase=[2, 4])")

b_obj.show()
Total running time of the script: ( 0 minutes 0.523 seconds)